FilmGrain
Interactive film colour visualisation
by:
Rowan Simmons
Professor Mark Apperley
Keith CE Soo
FilmGrain is an interactive piece that allows users to explore film colour separate from the context in which it is normally presented. We do this in order to explore the language of colour in films and to allow people to explore their own experience of the film in a new way.
Films are an integral part of our cultural zeitgeist, as time goes on, they have become more than entertainment, they have become a mirror that we point at ourselves in order to explore social issues and our position in the world. To do this they use a myriad of tools to communicate with us quickly and effectively and from a design perspective this communication is at the very heart of what we do. FilmGrain is designed to visualise the colours of a film in order to explore whether the visual language of colours developed by the director and director of photography stands up when removed from the context of the visuals.
1. Introduction
Colour has been an inescapable part of the cinematic experience since it was first introduced in the early 20th Century with such films as With Our King and Queen Through India [1] and Cupid Angling [2]. Colour brings with it all types of connotations and relationships and filmmakers have been using it to help tell their stories ever since those early days. The concept of visualising film colours is not new by any means, in the current popular form, known colloquially as “movie barcodes”, the most prominent practitioners online are moviebarcode.tumblr.com [3] and thecolorsofmotion.com [4].
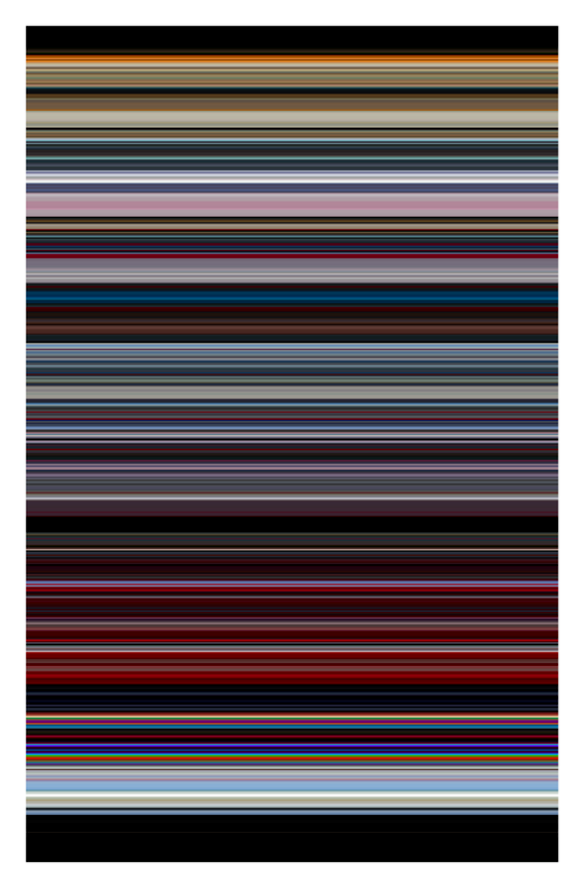
These barcodes take a small sample of frames from the film, calculate the average colour of the frame and visualises that colour as strips either vertically or horizontally, however this inadvertently changes the experience of the film as not every frame is represented and those that are can be quite some distance from one another chronologically. As shown in Figure 1, one frame is captured every ten seconds meaning that for 2001: A Space Odyssey, the visual can only display a total of 894 of 204,224 possible frames.
2. FilmGrain process
2.1 Capture
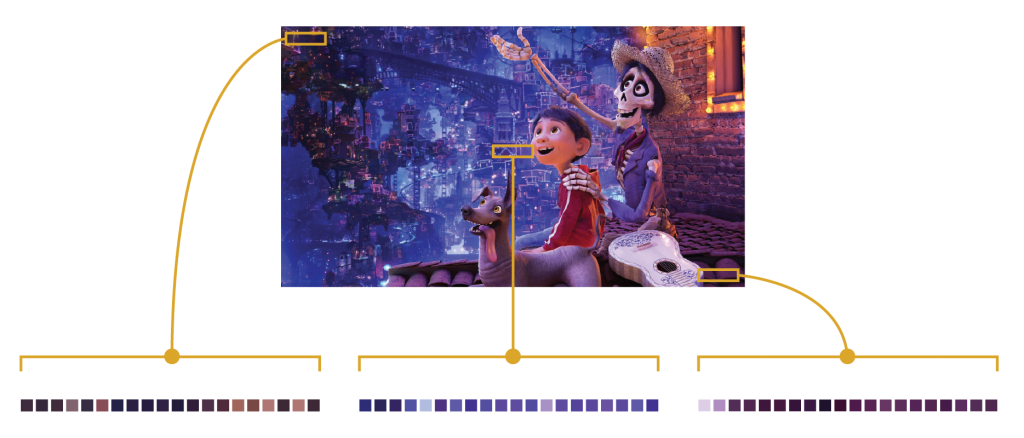
This is where FilmGrain differs, FilmGrain captures every frame from a film using the ffmpeg software [5] as this software is more efficient than anything we have so far written and then captures pixels from three locations in each frame (Top Left, Centre, Bottom Right) as shown in Figure 2. Twenty pixels are captured from each location within the frame in order to create a pool of colours that can be drawn from to fit the visualisation to different display resolutions. This results in 60 pixels being captured for every frame, which for a 90-minute film running at 24 frames per second saves 7,776,000 total pixels or 2,592,000 pixels for each screen location. These pools of pixels are saved into text files and loaded only when required.
2.2 Calculation
To fit the visualisation to the display resolution FilmGrain uses the following calculation to determine how many pixels to take from each pool:
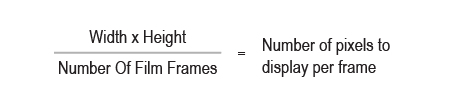
This calculation has a drawback in that due to the inability to display partial pixels, the calculation rounds to whole integers and due to the variability of the lengths of films and display resolutions, films often do not fit completely on the vertical area of the screen and will appear too short. We have considered stretching the visualisation image to fit but that is an undesirable solution as it would distort the scale of the colours from film to film rendering comparison impossible.
2.3 Construction
FilmGrain then presents the pixels for each location sequentially, left to right, top to bottom on the screen as shown in Figure 4. This is done in order to maintain sequence of the frames and to present the film in one screen, with no need for scrolling to see all the data which we feel is an improvement over other approaches.
2.4 Output
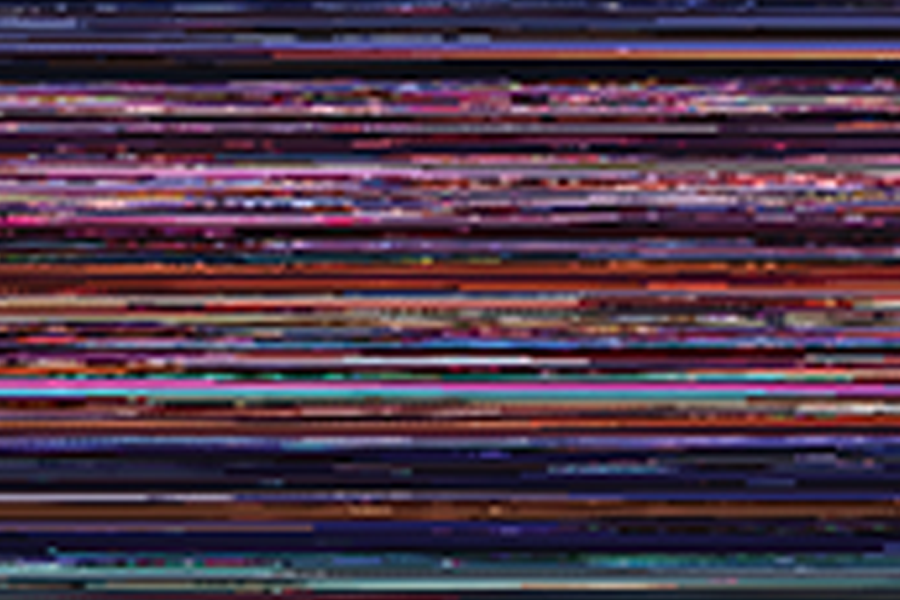
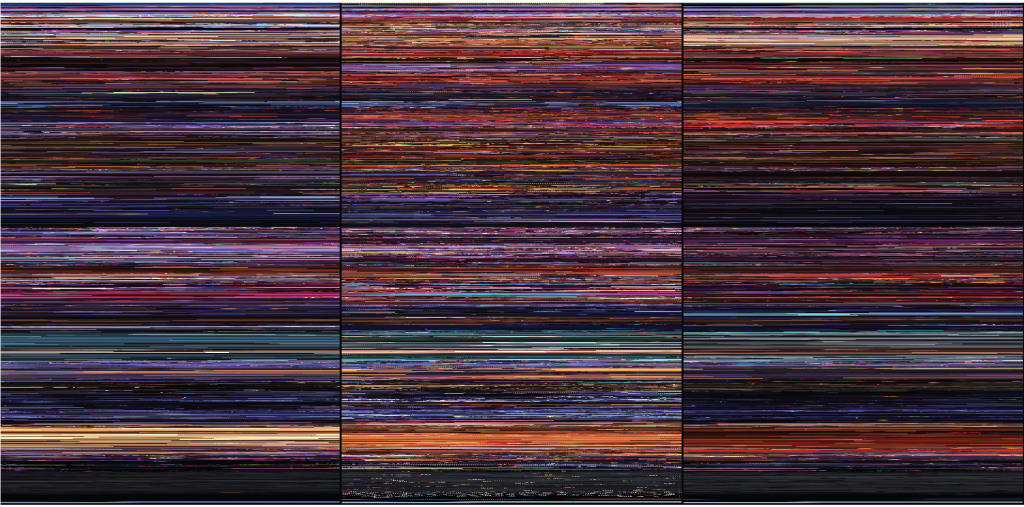
The three locations are visualised in their own “panel” to allow comparison of the variations of the colours across the frame. This presentation has the effect of creating a “grain” as the sequences of pixels change, hence the name of the project. Figure 5 shows the typical three panel visualisation of a film by FilmGrain showing top left pixels in the left panel, centre pixels in the centre panel and bottom right pixels in the right panel. These panels are also able to be clicked in order to fill the screen, pixels are reloaded, amounts are recalculated, and the visualisation is redrawn as a single panel over the entire screen.
We have found that if people are familiar with the film on display, they can actually “read” the image and identify moments in the film based solely on the colours in the context of the visual narrative. We believe FilmGrain also has utility as a tool for people to use in order to delve into films and start considering the colours of a film as a deliberate choice. This is not just limited to cinephiles, this can be of use to anyone as colour is an integral part of our daily lives and so by really considering colours in the media we consume, we can become more sensitive to visual languages at work in our daily lives.
3. Conclusion
“Movie Barcodes” have become an increasingly interesting medium for visual and data exploration. At the time of writing (12/2019), the authors have become aware of the work of Jason Salavon, most notably his piece from 2001 titled MTV's 10 Greatest Music Videos of All Time [6]. It is a jarring similarity purely because of the identical approach to the presentation of the colours. This clearly indicates that this is an engaging way to approach the visualisation of movie colour and will not be the last time it is discovered.
References:
[1] https://www.imdb.com/title/tt0008984/
[2] https://www.imdb.com/title/tt0243880/
[3] https://moviebarcode.tumblr.com
[4] https://thecolorsofmotion.com
[5] https://ffmpeg.org/
[6] http://www.salavon.com/work/MtvsTop10/image/205/
;)